![]()
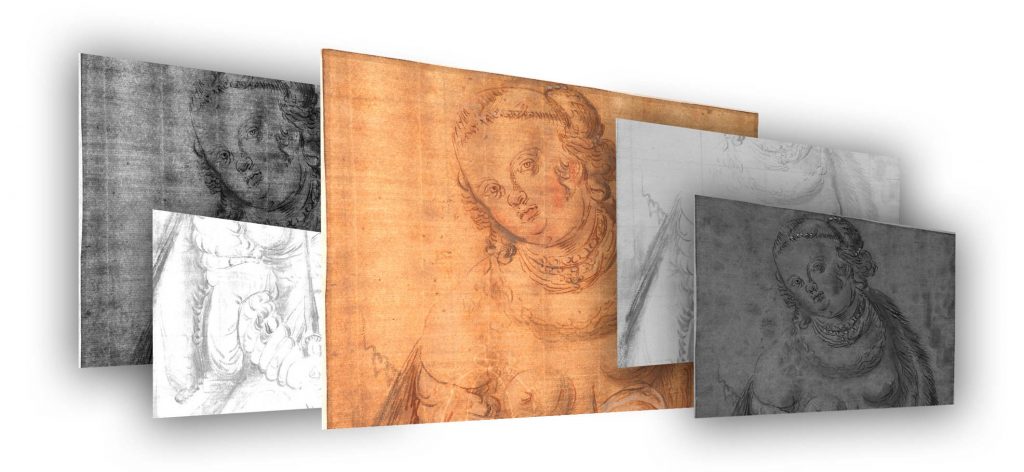
book2net has developed a new method for multispectral analysis of documents and drawings.
The development of an innovative technology for multispectral analyzes in the range of 300 – 1300 nm was the task of our research project. At definable nm intervals, individual or series of scans can be performed. The scan results can be superimposed pixel by pixel and analyzed. The book2net method works without filter change (vibration-free) and without post-correction of sharpness and focus in the spectral ranges (i.e. pixel scale accurate). Pixel-accurate overlay, division, subtraction and addition techniques can be applied to this database for image analysis and visualization of the desired information.
A systematic standardization of the scanning, light and imaging processes and deposition of profile structures enables comparability and repeatability. Profile structures allow the formation of classes or analysis groups.
[image_frame style=”framed_shadow” align=”center” width=”1024″ height=”472] [/image_frame]
Applications
In the field of multispectral analysis of documents, the following special fields of application can be defined:
Reconstruction of documents
Different damage classes, each with specific analysis methods: fire damage, water damage, mold, aging damage or combinations of several damage classes.
Examples: fire damage Anna Amalia Library Weimar, water damage Cologne City Archive, adhesive residues and mold Klassik Stiftung Weimar
Authentication of drawing
Example: complete multispectral analysis of the Lucretia, Klassik Stiftung Weimar, Graphic Art Collections
Material analysis in documents and drawings
On the basis of self-created reference and test targets comparative material considerations are carried out.
e.g. Analysis of ink, graphite pencil, lead handle, etc.
e.g. Analysis of white “colors”: lead white, lithipone, zinc white, rubber, white, gypsum, lime, etc.
Spectral Range
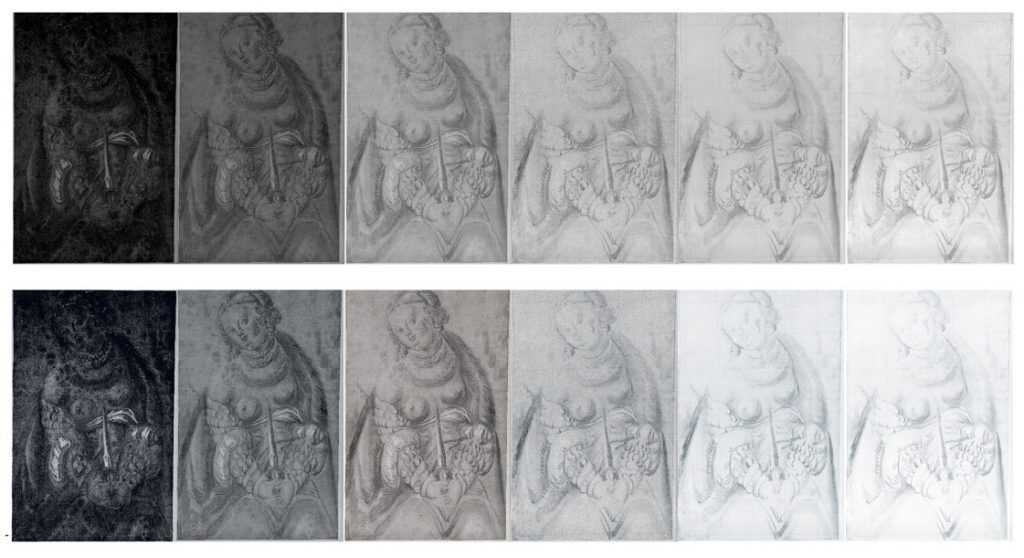
Scan series with reflected light and reflected light plus transmitted light form the database for the multispectral analysis. The example shows the spectral range from 350nm up to 950nm (optional up to 1250nm) with a selected increment of 100nm.
[image_frame style=”framed_shadow” align=”center” width=”1024″ height=”558] [/image_frame]
The software filter processes the native analog information specific to each spectral region while automatically generating a color image, false colors (UV/IR/VIS), 3 color channels and grayscales.
Underdrawings
[fancy_images]
[image title=”Hatching” caption=”Hatching”]http://www.books2ebooks.com/wp-content/uploads/2019/02/Multi4.png[/image]
[image title=”Underdrawing” caption=”Underdrawing”]http://www.books2ebooks.com/wp-content/uploads/2019/02/Multi5.png[/image]
[image title=”Auxiliary Lines” caption=”Auxiliary Lines”]http://www.books2ebooks.com/wp-content/uploads/2019/02/Multi9.jpg[/image]
[/fancy_images]
[clearboth]
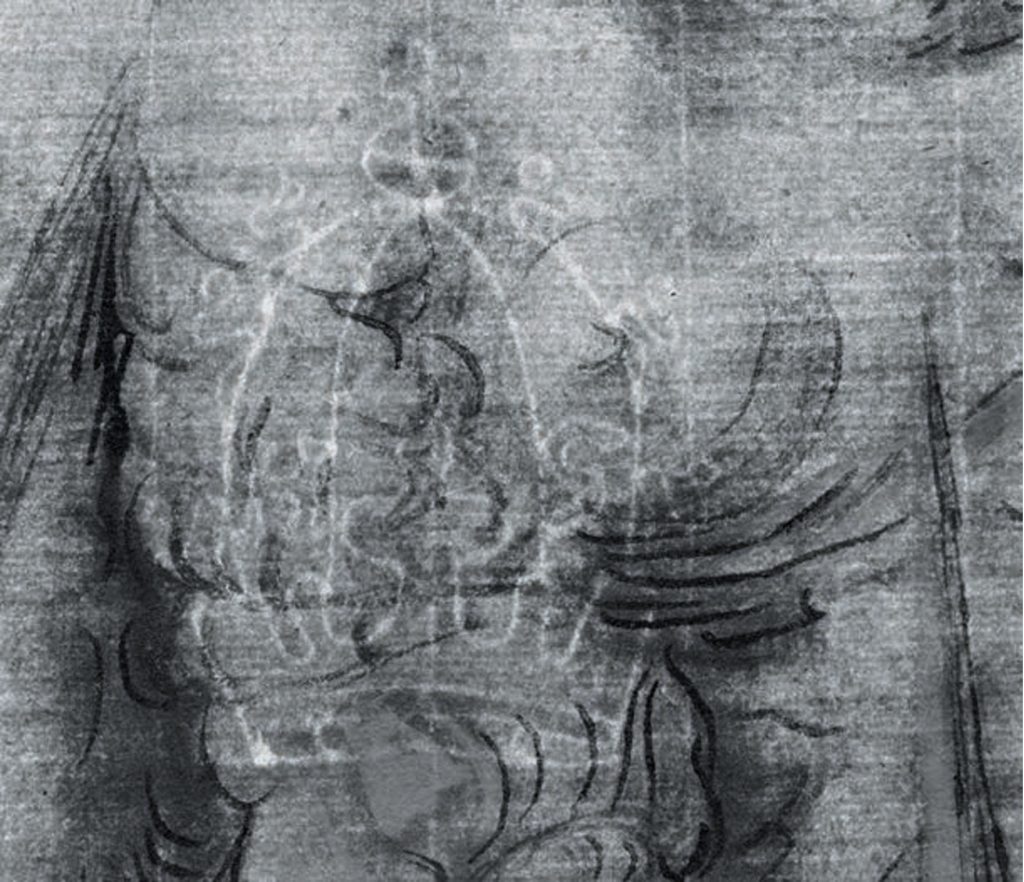
The different levels of the drawing are clearly distinguishable in the IR range. Recognizable auxiliary lines might have been used as perspective tools for copies or scale changes.
Pixel Overlay
The pixel overlay technique allows to extract the material structure, watermarks etc. The pixel difference analysis allows detailed comparisons between the individual levels of the drawing:
[fancy_images]
[image title=”Analysis frames for defining specific sections” caption=”Analysis frames for defining specific sections”]http://www.books2ebooks.com/wp-content/uploads/2019/02/Multi7.jpg[/image]
[image title=”Example: position correction of the right eye” caption=”Example: position correction of the right eye”]http://www.books2ebooks.com/wp-content/uploads/2019/02/Multi8.jpg[/image]
[/fancy_images]
[clearboth]
Authentication
Watermarks, signatures or material structures are visualized by the image analyser, providing evidence of origin and originality (comparison with databases or proofed originals of the artist).
[image_frame style=”framed_shadow” align=”center”] [/image_frame]
[clearboth]
[button link=”/contact-us” size=”medium” variation=”orange”]Get Expert Advice Today![/button]